Northridge, CA Housing Market 2026: What Homes Actually Sell For
Northridge, CA Housing Market 2026: What Homes Actually Sell For
In this article:
Depending on the month, the data source, and which side of Northridge the home is on. Homes are shifting from a frenzied seller's market to a calmer, more negotiable one.
If you've searched "Northridge home prices" and come away more confused than when you started, you're not imagining it. Zillow says one number. Redfin says another. Your neighbor's Realtor mentioned a third. None of them are lying to you. They're just measuring different things, at different times, over different areas.
I've been selling real estate in the San Fernando Valley for over 20 years, and I still pull fresh numbers before every listing appointment because the market changes month to month. Here's what the actual closed sales data shows for Northridge right now, and just as important, why the numbers you find online rarely match what a home really sells for.
What Northridge Homes Are Actually Selling For
Northridge covers a lot of ground, roughly 9.5 square miles, and it's split mainly between two zip codes: 91324 and 91325. Treating "Northridge" as one single market is where most of the online confusion starts. Here's how the two sides compare using the most recent 12-month sales data available:
91324
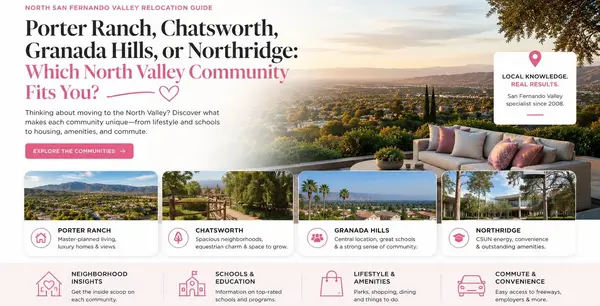
North & west Northridge, toward Porter Ranch and Chatsworth
91325
South & east Northridge, toward CSUN, Reseda, and Lake Balboa
Source: RealtyTrac 12-month sales data by zip code, reflecting sales through mid-2026.
That's nearly a $300,000 gap between the two zip codes, which tells you a simple truth: there is no single "Northridge price." Lot size, whether a home has been updated, proximity to CSUN and the busier corridors versus the quieter streets near Porter Ranch, and school boundaries all move the number far more than the zip code label does. A ranch-style home on a quiet street in 91324 and a renovated two-story near CSUN in 91325 are really two different markets wearing the same neighborhood name.
Looking at Northridge as a whole rather than by zip code, recent citywide snapshots put the overall median sold price between roughly $975,000 and $1,059,000 depending on the exact month measured, with price per square foot generally landing between $513 and $530.
Curious what your specific street and square footage would actually sell for? I can pull real comps for your exact block, not a citywide average.
Get Your Home ValuationWhy the Number You See Online Doesn't Match What Sellers Actually Get
This is the part most articles skip, and it's usually the real question behind the search. Here's why Zillow, Redfin, and RealtyTrac can each show you a different "Northridge price" in the same week, all while being accurate for what they're actually measuring.
They measure different things
Zillow's Zestimate (called the ZHVI, or Zillow Home Value Index) is a smoothed, computer-generated estimate of typical value across the whole area. It recently showed Northridge around $1,036,000, down about 2.7% over the past year. That's different from Zillow's own median sale price of homes that actually closed, which was closer to $977,667 at the end of 2025. One is a model. The other is real closed transactions. They will almost never match exactly, and neither is "wrong."
They use different time windows
Redfin's neighborhood page showed a median sale price of $975,000 as one snapshot, while a citywide roll-up taken a few months later showed $1,059,000. Northridge typically sees only 100 to 150 home sales a month. With a sample that small, one month with a run of higher-end sales near CSUN, or a cluster of smaller starter homes in 91324, can swing the median by tens of thousands of dollars. A single month's number is a snapshot, not a trend.
They draw the boundaries differently
"Northridge" on one site might mean the full zip codes. On another, it might mean a hand-drawn neighborhood polygon that excludes streets near the border with Porter Ranch or Reseda. Neither is more correct, but it means you genuinely cannot compare a number from one site to a number from another site and assume they're describing the same homes.
The honest takeaway: automated estimates are a reasonable starting point for curiosity, but they are not a pricing strategy. If you're actually buying or selling, you need someone pulling live comps for the specific streets and property type you care about, not a citywide average from a website.
How Long Homes Are Taking to Sell
This is where the market's real story shows up. A year ago, Northridge homes were going pending in the low to mid-30s of days. As of mid-2026, that's stretched to roughly 46 to 52 days on average, which is close to a 40% increase in how long a well-priced home typically sits before it sells.
At the same time, inventory has grown sharply. In 91324, active listings jumped about 152% year over year (from roughly 125 homes on the market to over 300), while 91325 saw an even bigger jump. More sellers are testing the market, and buyers finally have real choices instead of fighting over three listings.
Here's what that combination actually means: the market hasn't collapsed, and it hasn't sped back up either. It's rebalanced. Most homes are still selling close to list price (recent data shows the typical Northridge home selling within about 1% of asking, with well-priced "hot" homes still pulling 2% or more over list). But the days of listing on a Thursday and having ten offers by Monday are largely behind us for now. Mortgage rates sitting around 6.65% (the 30-year average as of late August 2026, per Freddie Mac) are the biggest reason buyers are being more selective and taking their time.
What This Means If You're Buying or Selling in Northridge Right Now
If you're selling: pricing accurately from day one matters more than it did two years ago. In a slower market, an overpriced listing doesn't just sit, it becomes stale, and stale listings train buyers to assume something is wrong with the home even when there isn't. The homes still selling quickly and near asking are the ones priced correctly against real recent comps, not last year's Zestimate.
If you're buying: you have more room to negotiate than you would have in 2021 through 2023, but "more room" doesn't mean every seller will budge. With rates around 6.65%, run your numbers carefully before you fall in love with a listing price, and don't assume the online estimate reflects what the seller will actually accept.
More inventory means more choices right now. Take a look, no pressure, no forms to fill out.
Browse Homes for SaleIf you're just watching the market: the honest read is that Northridge values have mostly leveled off after a few volatile years, with some pockets (like parts of 91325 near CSUN) still climbing modestly while others have softened slightly. That's a healthier, more sustainable pattern than the sharp swings we saw during the pandemic years.
Not sure what your monthly payment would actually look like at today's rates? Run your own numbers, or let's talk through your specific situation.
Try the Mortgage Calculator Affordability CalculatorFrequently Asked Questions
What is the median home price in Northridge, CA right now?
Depending on the source and the exact month measured, the median sold price for Northridge has recently ranged from about $925,000 to just over $1.06 million. The northern zip code, 91324, tends to run lower (around $925,000 to $935,000), while the southern zip code, 91325, tends to run higher (over $1.2 million), which pulls the citywide average around depending on how many sales close on each side that month.
Are home prices going up or down in Northridge?
It depends on which part of Northridge and which time window you look at. 91325 has shown median sold prices up roughly 6.7% over the past year, while 91324 has shown sold prices down roughly 1.8% over the same period, even as asking prices rose in both areas. Overall, Northridge has cooled off its earlier pace of appreciation rather than dropping sharply.
Is Northridge a buyer's market or a seller's market in 2026?
It's closer to balanced than it's been in years. Homes are taking about 45 to 52 days to sell on average, up from the low 30s a year ago, and inventory has grown significantly. Sellers who price accurately are still selling near asking price. Sellers who overprice are sitting. Buyers have more choices and more negotiating room than they've had since before the pandemic.
How much over or under asking price are Northridge homes selling for?
Recent data shows the typical Northridge home selling within about 1% of its list price, with well-priced, move-in-ready homes still occasionally selling 2% or more over asking. Roughly half of recent sales closed below the original list price, which reflects more room for negotiation than in prior years.
Should I trust Zillow's Zestimate for my Northridge home?
Use it as a rough starting point, not a pricing decision. Zillow's Zestimate is a computer-generated model based on public data and area trends. It doesn't know if your kitchen was remodeled last year, if your lot is oversized, or if three nearly identical homes just sold on your street last month. An accurate price comes from a licensed agent pulling live, comparable sales for your specific home, not an automated estimate.
What's the difference between the 91324 and 91325 real estate markets?
91324 sits toward the northern and western half of Northridge, closer to Porter Ranch and Chatsworth, and has recently run a median sold price around $925,000. 91325 covers more of the southern and eastern half, nearer CSUN, Reseda, and Lake Balboa, with a median sold price over $1.2 million. The price per square foot is fairly close between the two (roughly $530 to $536), so the price gap comes more from home size, lot size, and updates than from land value alone.
Every market conversation eventually comes back to the same question: what does this mean for your home, your budget, and your timeline? Numbers on a screen can only take you so far. If you'd like to talk through what these trends actually mean for your specific street or your specific search, just send me a message below, no pressure, just an honest conversation.
Related Reading
- Is Now a Good Time to Sell in the San Fernando Valley? (suggested internal link, publish and link once live)
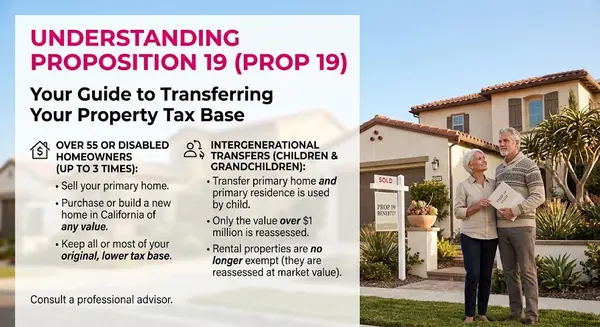
- Understanding Prop 19 for Northridge Homeowners Over 55 (suggested internal link)
- Porter Ranch Housing Market 2026: What Homes Actually Sell For (suggested companion article)
- How Much Is My Northridge Home Worth? A No-Pressure Guide (suggested internal link, tie to /evaluation)
Categories
Recent Posts






Send me a message!

Agent License ID: 01840894